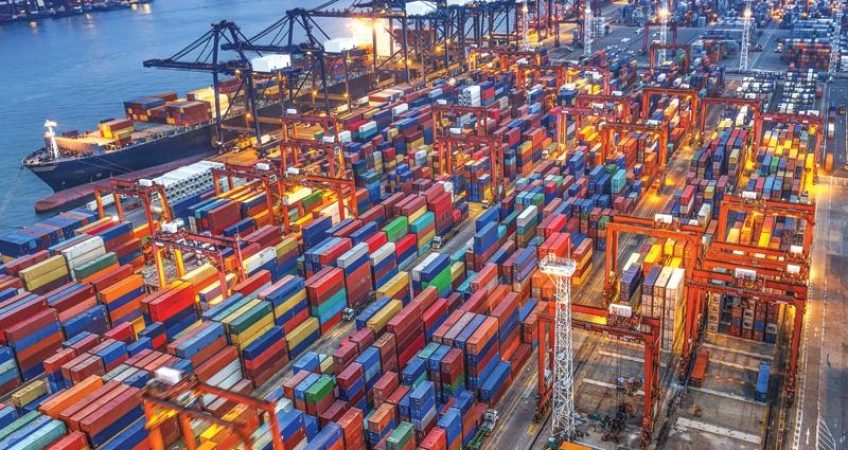
Solid growth in global trade volumes in 2018 pushed the total container throughput of the 50 busiest cargo ports in the world up 4.6 percent year over year to almost half a trillion TEU, according to the JOC Top 50 Container Ports 2018 rankings.
On a regional level, ports in Asia — including the Middle East and Indian subcontinent — continued to dominate the ranks, accounting for nearly 78 percent of the combined 498.76 billion TEU handled by the top 50 container ports last year. By comparison, European and North American ports represented 12.4 percent and 6.6 percent of the total, respectively. The largest non-Asian port, Rotterdam, was still unable to crack the top 10 despite a 5.6 percent increase in container throughput to 14.5 million TEU.
The Port of Shanghai maintained its top spot on the list, reporting a 4.4 percent increase in container volume to just over 42 million TEU, more than four times the 9.5 million TEU handled by the busiest North American port, Los Angeles. Coming in at No. 2, the Port of Singapore reported the highest growth rate of any port in the top 20, increasing throughput 8.7 percent to 36.6 million TEU for the year.

Better-than-average growth of 7.1 percent helped China’s Ningbo-Zhoushan port surpass fellow Chinese gateway Shenzhen to take third place, while Guangzhou’s 7.6 percent growth was enough to propel it ahead of Busan, South Korea, which fell to No. 6 despite a 5.8 percent uptick in volume. Meanwhile, the flagging Port of Hong Kong, which held the distinction of the world’s busiest container port until it was dethroned by Singapore in 2004, continued to slide down the list, dropping two spots to No. 7 as its throughput dipped 5.6 percent to 19.6 million TEU.
Albeit from a smaller base, the fastest-growing ports in the top 50 last year were Rizhao, China, which saw container volume surge 24.2 percent to 4 million TEU; Piraeus, Greece, up 18.3 percent to 4.77 million TEU; Barcelona, Spain, up 15.1 percent to 3.42 million TEU; and Colombo, Sri Lanka, up 13.5 percent to 7.05 million TEU.
Only seven of the top 50 showed negative growth from 2017, two of which were still in the top 10: Hong Kong and Dubai’s Jebel Ali. The largest declines, however, took place at Salalah, Oman, which saw throughput drop 14.2 percent to 3.39 million TEU, and Felixstowe, United Kingdom, down 10.5 percent to 3.85 million TEU.
JOC.com’s annual Top 50 Global Container Ports ranking is assembled using throughput data from port authorities, IHS Markit, and maritime industry analyst Alphaliner. IHS Markit is the parent company of JOC.com. The figures are expressed in millions of TEU, the most common measurement of containerized ocean shipping. One standard 40-foot ocean container equals two TEU. Non-containerized cargoes — i.e. dry bulk, liquid bulk, roll-on/roll-off (ro-ro), and oversized/heavy-lift project freight — are not included.
| RANK | PORT | COUNTRY | 2018 | 2017 | PERCENT VOLUME CHANGE |
| 1 | Shanghai | China | 42.01 | 40.23 | 4.40% |
| 2 | Singapore | Singapore | 36.6 | 33.67 | 8.70% |
| 3 | Ningbo-Zhoushan | China | 26.35 | 24.61 | 7.10% |
| 4 | Shenzhen | China | 25.73 | 25.21 | 2.10% |
| 5 | Guangzhou | China | 21.92 | 20.37 | 7.60% |
| 6 | Busan | South Korea | 21.66 | 20.47 | 5.80% |
| 7 | Hong Kong | China | 19.6 | 20.76 | -5.60% |
| 8 | Qingdao | China | 19.31 | 18.3 | 5.50% |
| 9 | Tianjin | China | 16 | 15.07 | 6.20% |
| 10 | Jebel Ali | UAE | 14.95 | 15.37 | -2.70% |
| 11 | Rotterdam | Netherlands | 14.5 | 13.73 | 5.60% |
| 12 | Port Klang | Malaysia | 12.32 | 11.98 | 2.80% |
| 13 | Antwerp | Belgium | 11.1 | 10.45 | 6.20% |
| 14 | Xiamen | China | 10.7 | 10.38 | 3.10% |
| 15 | Kaohsiung | Taiwan | 10.45 | 10.27 | 1.70% |
| 16 | Dalian | China | 9.77 | 9.7 | 0.70% |
| 17 | Los Angeles | US | 9.46 | 9.34 | 1.30% |
| 18 | Tanjung Pelepas | Malaysia | 8.96 | 8.38 | 6.90% |
| 19 | Hamburg | Germany | 8.77 | 8.86 | -1.00% |
| 20 | Keihin ports | Japan | 8.14 | 7.98 | 2.00% |
| 21 | Long Beach | US | 8.09 | 7.54 | 7.30% |
| 22 | Laem Chabang | Thailand | 8.07 | 7.78 | 3.70% |
| 23 | Tanjung Priok | Indonesia | 7.8 | 6.92 | 12.70% |
| 24 | New York and New Jersey | US | 7.18 | 6.71 | 7.00% |
| 25 | Colombo | Sri Lanka | 7.05 | 6.21 | 13.50% |
| 26 | Yingkou | China | 6.5 | 6.28 | 3.50% |
| 27 | Suzhou | China | 6.36 | 5.88 | 8.10% |
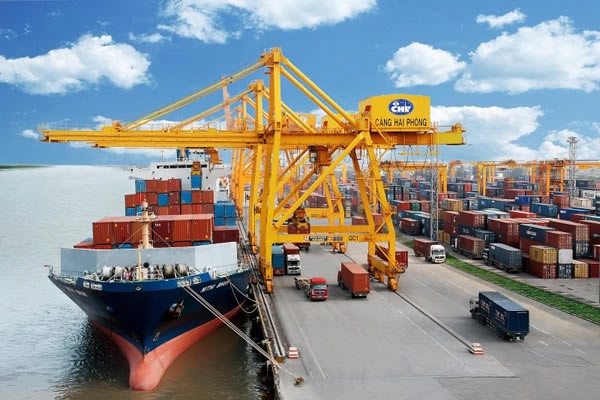
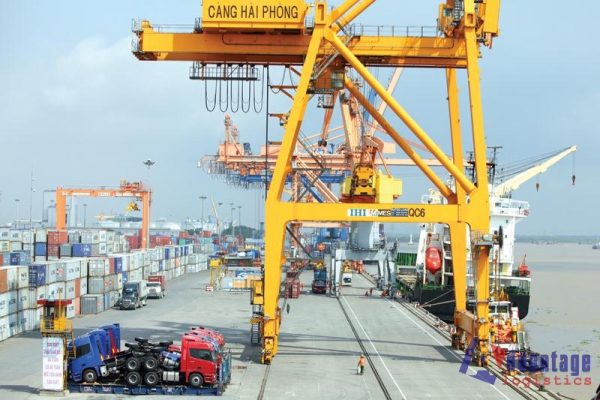
| 28 | Ho Chi Minh City/Cai Mep | Vietnam | 6.33 | 5.94 | 6.60% |
| 29 | Bremen/Bremerhaven | Germany | 5.48 | 5.51 | -0.50% |
| 30 | Valencia | Spain | 5.18 | 4.83 | 7.20% |
| 31 | Manila | Philippines | 5.05 | 4.82 | 4.80% |
| 32 | Jawaharlal Nehru Port Trust | India | 5.05 | 4.71 | 7.20% |
| 33 | Piraeus | Greece | 4.91 | 4.15 | 18.30% |
| 34 | Algeciras | Spain | 4.77 | 4.39 | 8.70% |
| 35 | Hai Phong | Vietnam | 4.76 | 4.45 | 7.00% |
| 36 | Lianyungang | China | 4.75 | 4.72 | 0.60% |
| 37 | Mundra | India | 4.44 | 3.98 | 11.60% |
| 38 | Savannah | US | 4.35 | 4.05 | 7.40% |
| 39 | Colon | Panama | 4.32 | 3.89 | 11.10% |
| 40 | Jeddah | Saudi Arabia | 4.12 | 4.15 | -0.70% |
| 41 | Santos | Brazil | 4.12 | 3.85 | 7.00% |
| 42 | Rizhao | China | 4 | 3.22 | 24.20% |
| 43 | Felixstowe | UK | 3.85 | 4.3 | -10.50% |
| 44 | Northwest Seaport Alliance | US | 3.79 | 3.7 | 2.40% |
| 45 | Tanger Med | Morocco | 3.47 | 3.31 | 4.80% |
| 46 | Barcelona | Spain | 3.42 | 2.97 | 15.10% |
| 47 | Vancouver | Canada | 3.4 | 3.25 | 4.60% |
| 48 | Salalah | Oman | 3.39 | 3.95 | -14.20% |
| 49 | Fuzhou | China | 3.34 | 3.01 | 11.00% |
| 50 | Marsaxlokk | Malta | 3.31 | 3.15 | 5.1 |
Source: https://hanghaikythuat.wordpress.com/2019/09/18/hai-cang-container-viet-nam-lot-top-50-the-gioi/